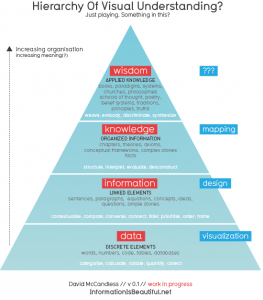
A great little info-graphic from Information is Beautiful (my favourite info-design site):
But, this is not necessarily a new concept (from the I.is B. post).
This structure has been around for a while. (In fact does anyone knows who first came up with it?). The only new thing is relating it to visuals. And giving it a nice font.
One interesting thing. If you visualise information without designing it, you often end up with a mush or a meaningless thicket.
A lot of times, as part of the reference process, “information” and “data” are considered enough to meet user needs, leaving the higher levels of the triangle to the user’s discretion.
As librarians increasingly become moderators or brokers of information, staking a claim on those higher tiers may be worthwhile. Information design can do a lot to achieve this.
Libraries are in the information sharing business, so considering how we present information visually is pretty important. I’m a big fan on the role design can play in representing complex ideas. The ability to take raw information and make it informative is something that makes good information design invaluable.
It may seem like a superficial concern, but information design is going to be more and more relevant.
The list is the simplest and most ubiquitous tool for returning information to users (be it via search engine, OPAC, or written lists of suggested titles). Even tag clouds are essential elaborate lists, but they are moves in the right direction.
The drive towards the semantic web (one day, maybe?) will lead to increased expectations from users. Search tools and providers will have to consider more complex and subtle contextual inputs. Because the results themselves will be increasingly nuanced, the dynamics of how this information is presented will be crucial.
I’ve really no idea about how this will turn out. But, since search engine results are essentially laid out the same now as in the 90s, I’d be open to any sort of evolution.
